
SiteInfo
Fully integrated tank level monitoring for more efficient deliveries, shorter lead times and less waste
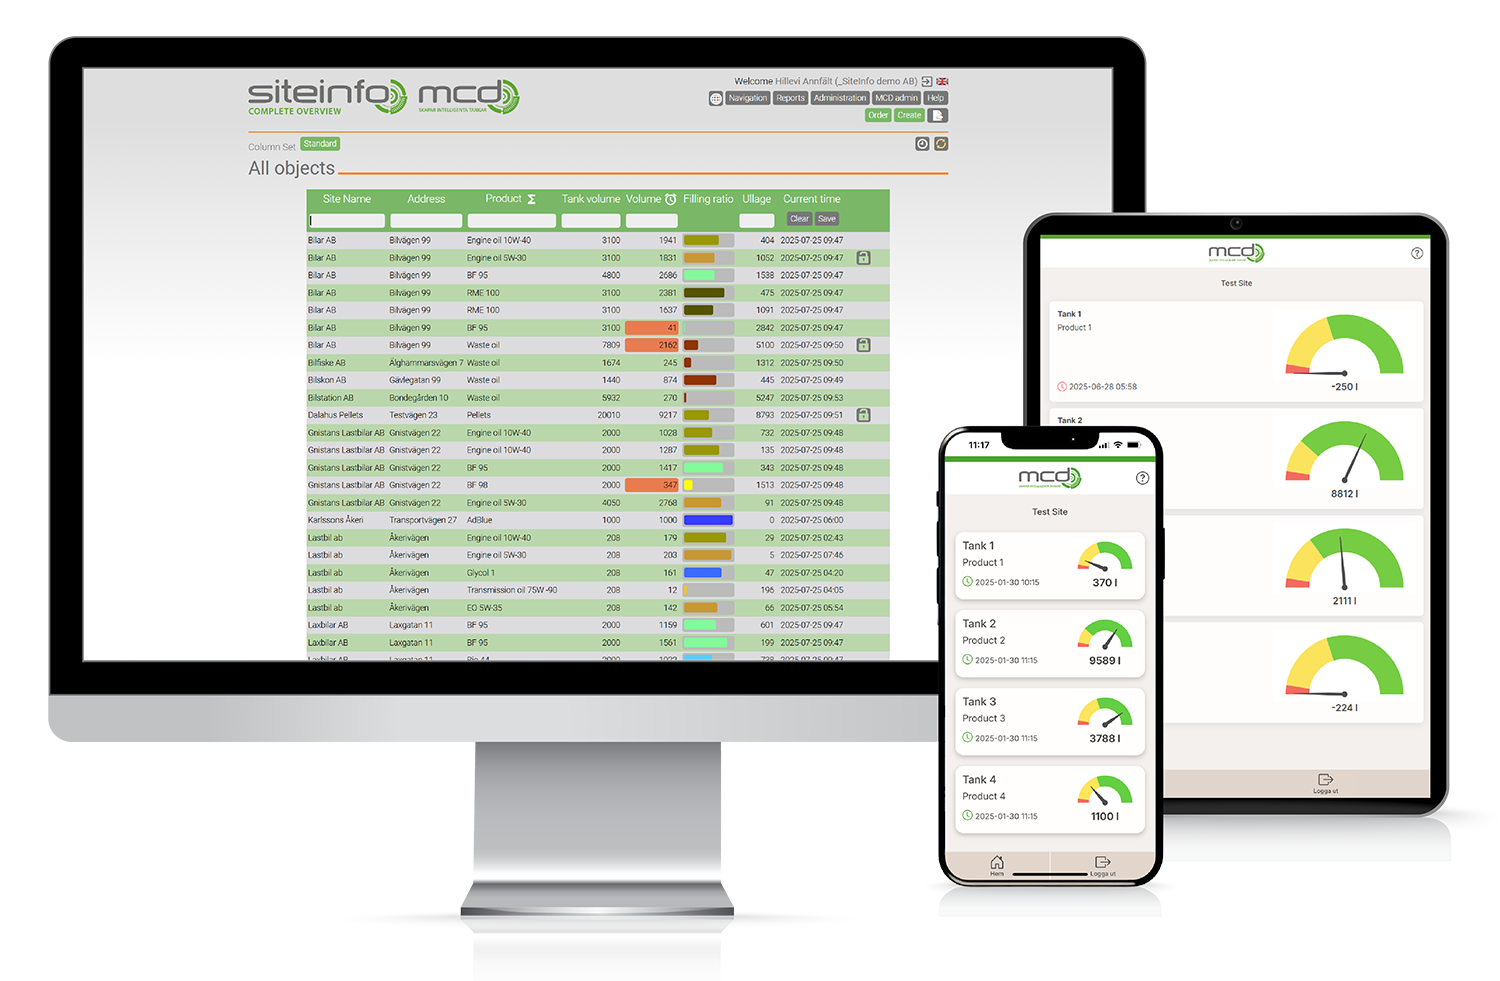
Full control with SiteInfo
SiteInfo is a cloud-based level monitoring service that makes your logistics simpler and more efficient. Automatic tank gauging and smart level monitoring give you full control and save both time and money. You check your tank levels from your computer or phone – and with full control, you avoid empty tanks, costly emergency deliveries and potential penalty fees.
You can also plan refills and deliveries more efficiently and reduce health and safety risks for your staff. And with shorter transport routes, you cut both transport costs and CO2 emissions.

Connect your system to SiteInfo
Over the years, we have helped most customers with their own local systems connect them to SiteInfo. Using our web APIs and data import/export, we can give you a full overview of your site.
By reusing your existing systems and presenting the data uniformly in SiteInfo, you get all your measurements in one place. We can also offer customised data import and export – contact us to find out more.
What can you do with SiteInfo?
Readouts
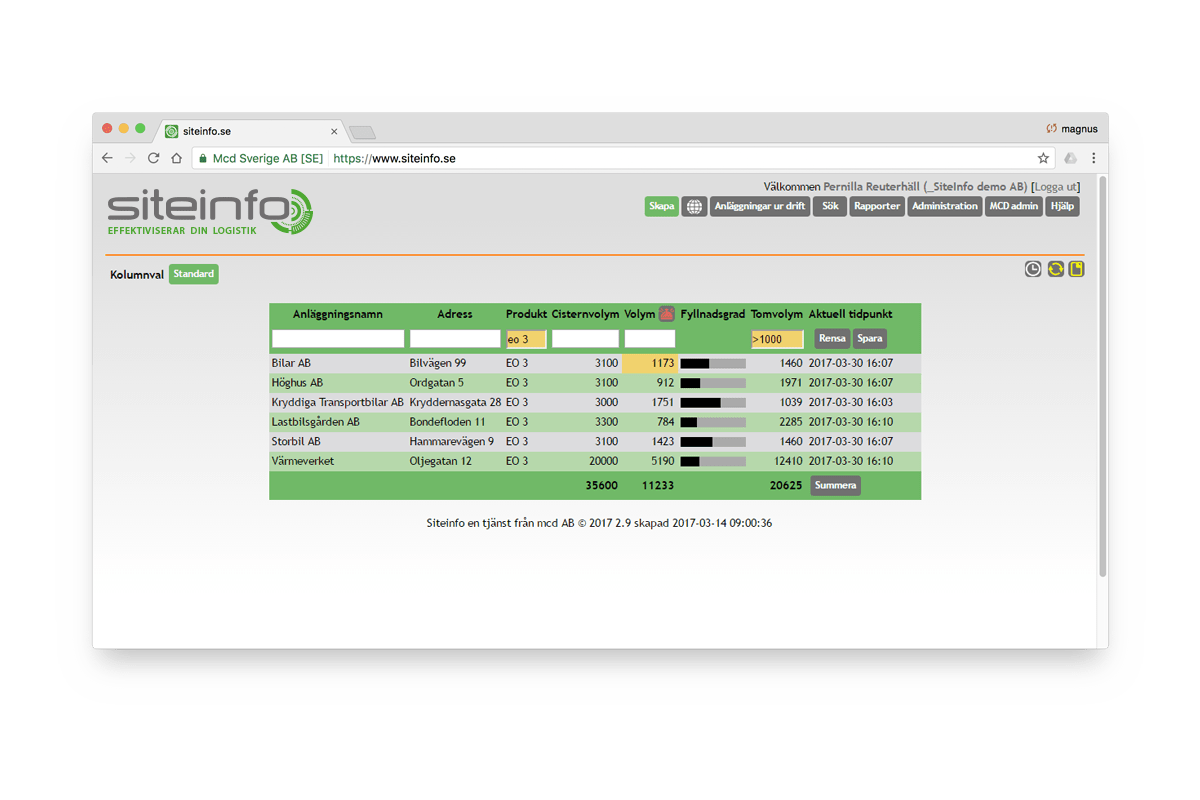
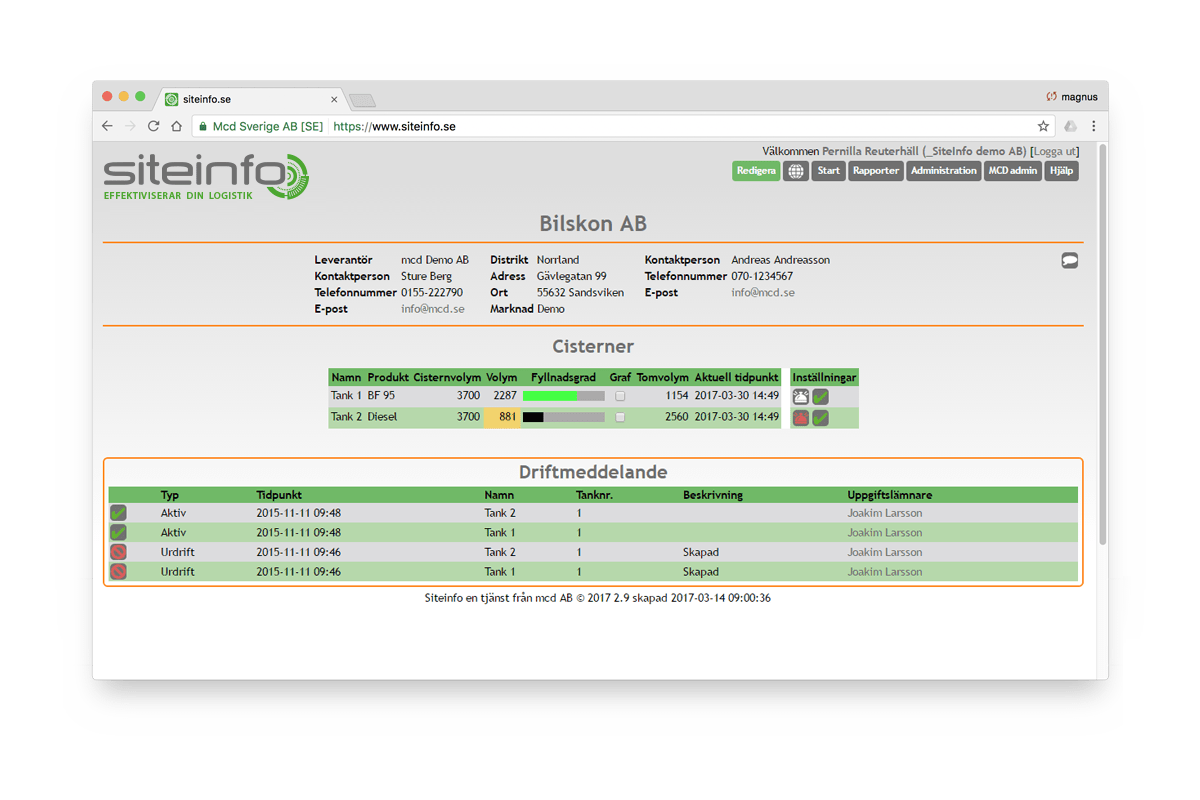
When you log in to SiteInfo, you see all sites connected to the service – a quick overview of your sites and the key information. You can customise the overview and sort sites the way you want, e.g. by site name, city or product.
As the number of connected sites grows, you can quickly find what you need by combining columns and filters.
You can set up email notifications for each tank when the level reaches the alarm level. Level history is saved every hour and shown as both a table and a graph.
Level monitoring wherever you are
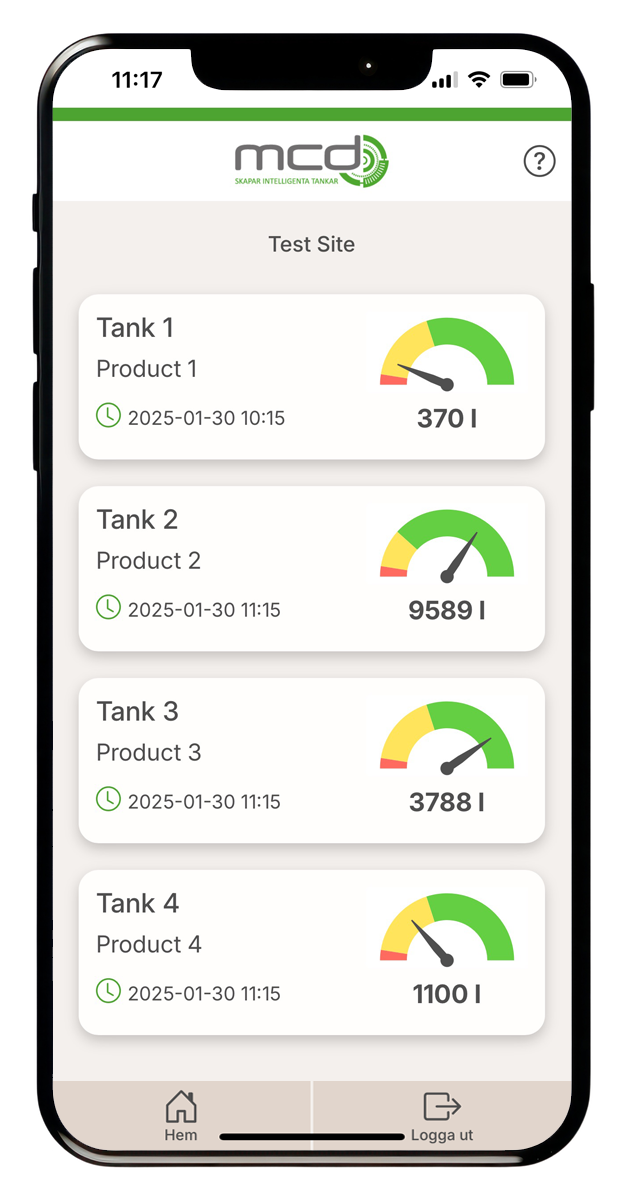
With SiteInfoApp, you can monitor your tank levels wherever you are. Designed for the end user, it brings together the key functions of SiteInfo. The app is free for all SiteInfo users – a service to make your working day smarter.
Just like the browser version, the app can be customised with your own logo and the settings you need. Contact us to find out more.
Graph and forecast
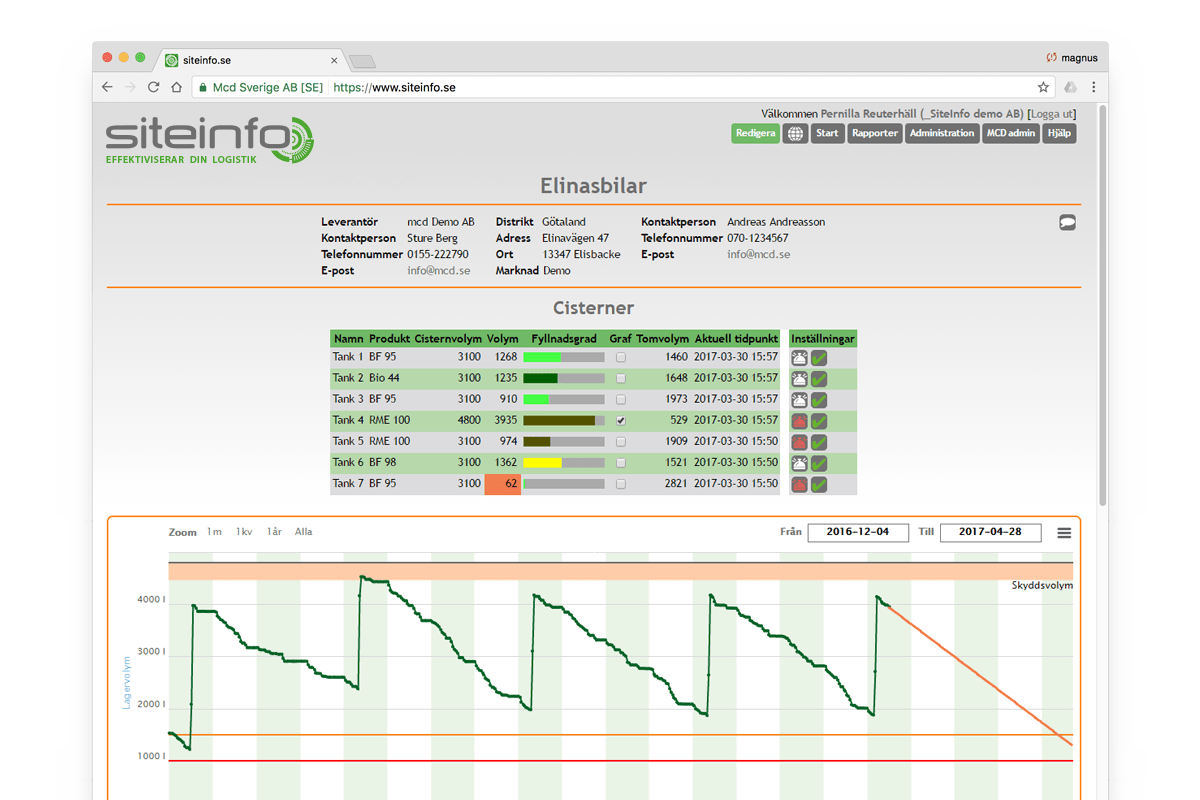
The graph gives you a historical overview of consumption over any period you choose. Level history is stored for up to three years.
The graph also shows the tank’s alarm and warning levels, as well as its safety volume and dead volume.
The collected data gives you detailed statistics for each site, such as average daily consumption and deliveries during the selected period. Based on the level history, you also get a consumption forecast for the tank.
Reports
SiteInfo gives you standard reports, for example stock and volume history. The reports are shown in SiteInfo and can be exported to Excel.
You can also create your own reports by combining columns and filters, and export them to Excel.
SiteInfo gives you a full overview
As an administrator, you get extra functions: you can see which users have access to your sites and their rights, create new user accounts, and edit users, contacts and products.
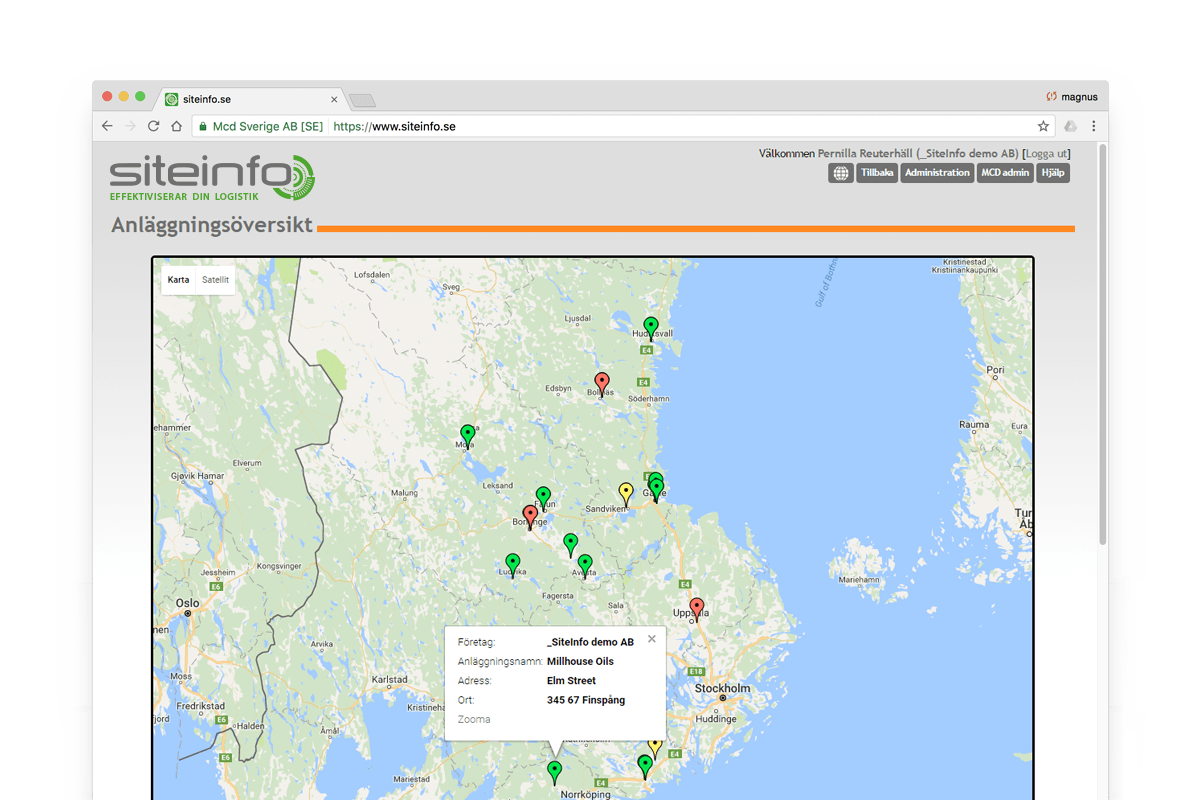
With the map view, you get an overview of selected tanks and their alarm and warning levels. If an alarm is triggered, the tank is shown on the map.
Subscription
The subscription is based on how often measurement data is transmitted. Data import via system APIs is available depending on the solution.
Minutes
Hours
Days
Data is transmitted daily or less often (battery-powered equipment).
Manual
Data is entered and transmitted manually, regardless of interval (SiteBasic).
How it works

1. Analysis
We meet to review your needs and the conditions on site.

2. Installation/Integration
Based on your needs, we agree on an action plan for installation or integration together with our project management or development team.

3. Commissioning
We train you and make sure you get started with SiteInfo right away. If you need help, our experienced support team and developers are only a phone call away.
In detail
In the analysis phase, we meet to discuss your needs and the conditions on site.
If measuring equipment is already in place, it can usually be kept – all you need is a SiteMonitor unit to connect it to SiteInfo.
If integration with another system is relevant, we look at what it requires.
We analyse your needs and present a suitable solution.
After the analysis we will send you a quote.
Once we have agreed, we install the hardware at your site or start the integration work.
If a measurement system is already in place, only SiteMonitor needs to be installed. The installation is carried out by MCD’s own technicians or one of our trained partners.
Your tanks are connected to SiteMonitor, which communicates with SiteInfo – and you can then easily monitor your levels at www.siteinfo.se.
Test installation is possible by arrangement.
For system integration, you get a dedicated contact person in our development team, and together we agree on an implementation plan.
Time to get started! With built-in help and getting-started training online, by phone or on site at MCD, you can start working in SiteInfo as soon as installation or integration is complete.
Want more in-depth training? We can tailor it to your needs.
Training can take place at our office in Nyköping or at your premises, whichever you prefer.
Do you want us to contact you?
